Creating a Custom Dashboard Without a Native Integration or API: The ProspectIn Use Case
by Anas El MhamdiOutbound prospecting tools save considerable time but frequently lack robust reporting capabilities such as APIs, integrations, or exports. This creates challenges when attempting to consolidate data across multiple accounts or channels.
Introduction
I encountered this limitation while managing four SDR LinkedIn accounts using ProspectIn, a LinkedIn prospecting tool. The only available options were checking the company dashboard directly or reviewing daily email reports—neither provided historical analysis or cross-account comparisons.
Most outbound prospecting tools lack proper reporting features: APIs, integrations, or exports. This makes data aggregation and trend analysis impractical when you need to consolidate information across multiple accounts.
The Solution Overview
Rather than accept these limitations, I developed a four-component system to create a custom dashboard:
- A Zapier trigger forwarding email reports to a custom webhook
- A webhook that extracts relevant data from HTML emails using BeautifulSoup
- A query API for flexible data retrieval from MongoDB
- A Retool dashboard for visualization and team access
This approach allows me to aggregate data from all four SDR accounts, track historical trends, and provide my team with an interactive dashboard for performance monitoring.
Step 1: Creating the Webhook and Trigger
Gmail Filter Setup
The first step is to apply a Gmail filter that automatically labels all ProspectIn company reports. This enables reliable Zapier trigger configuration that will fire consistently whenever a new report arrives.

Zapier Configuration
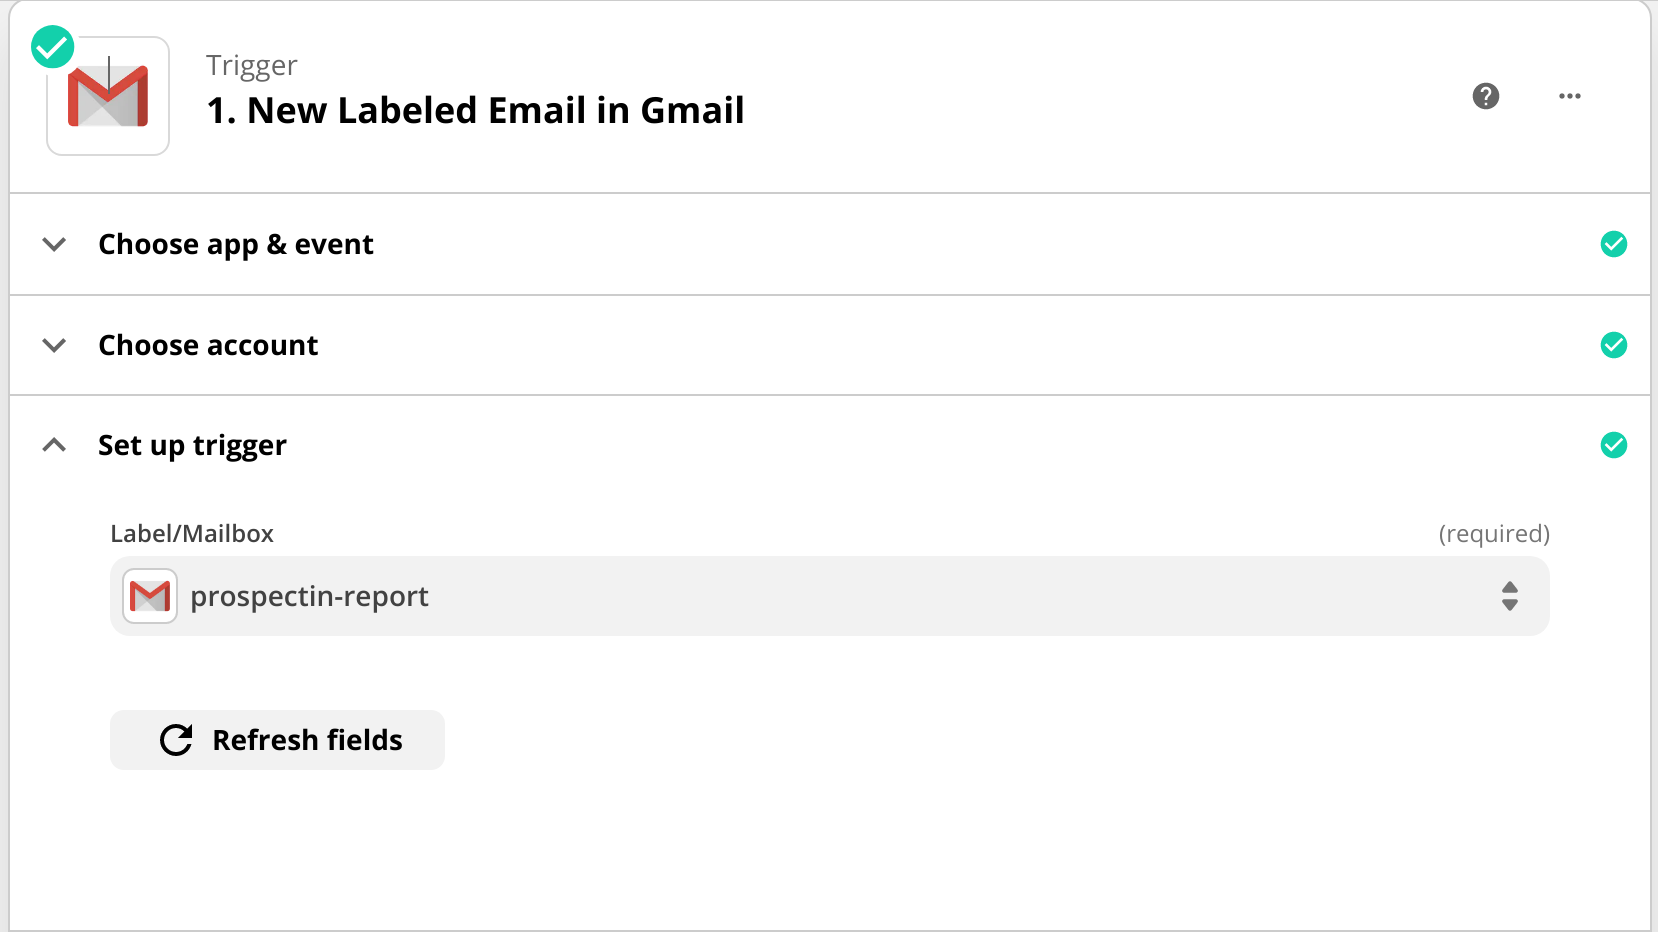
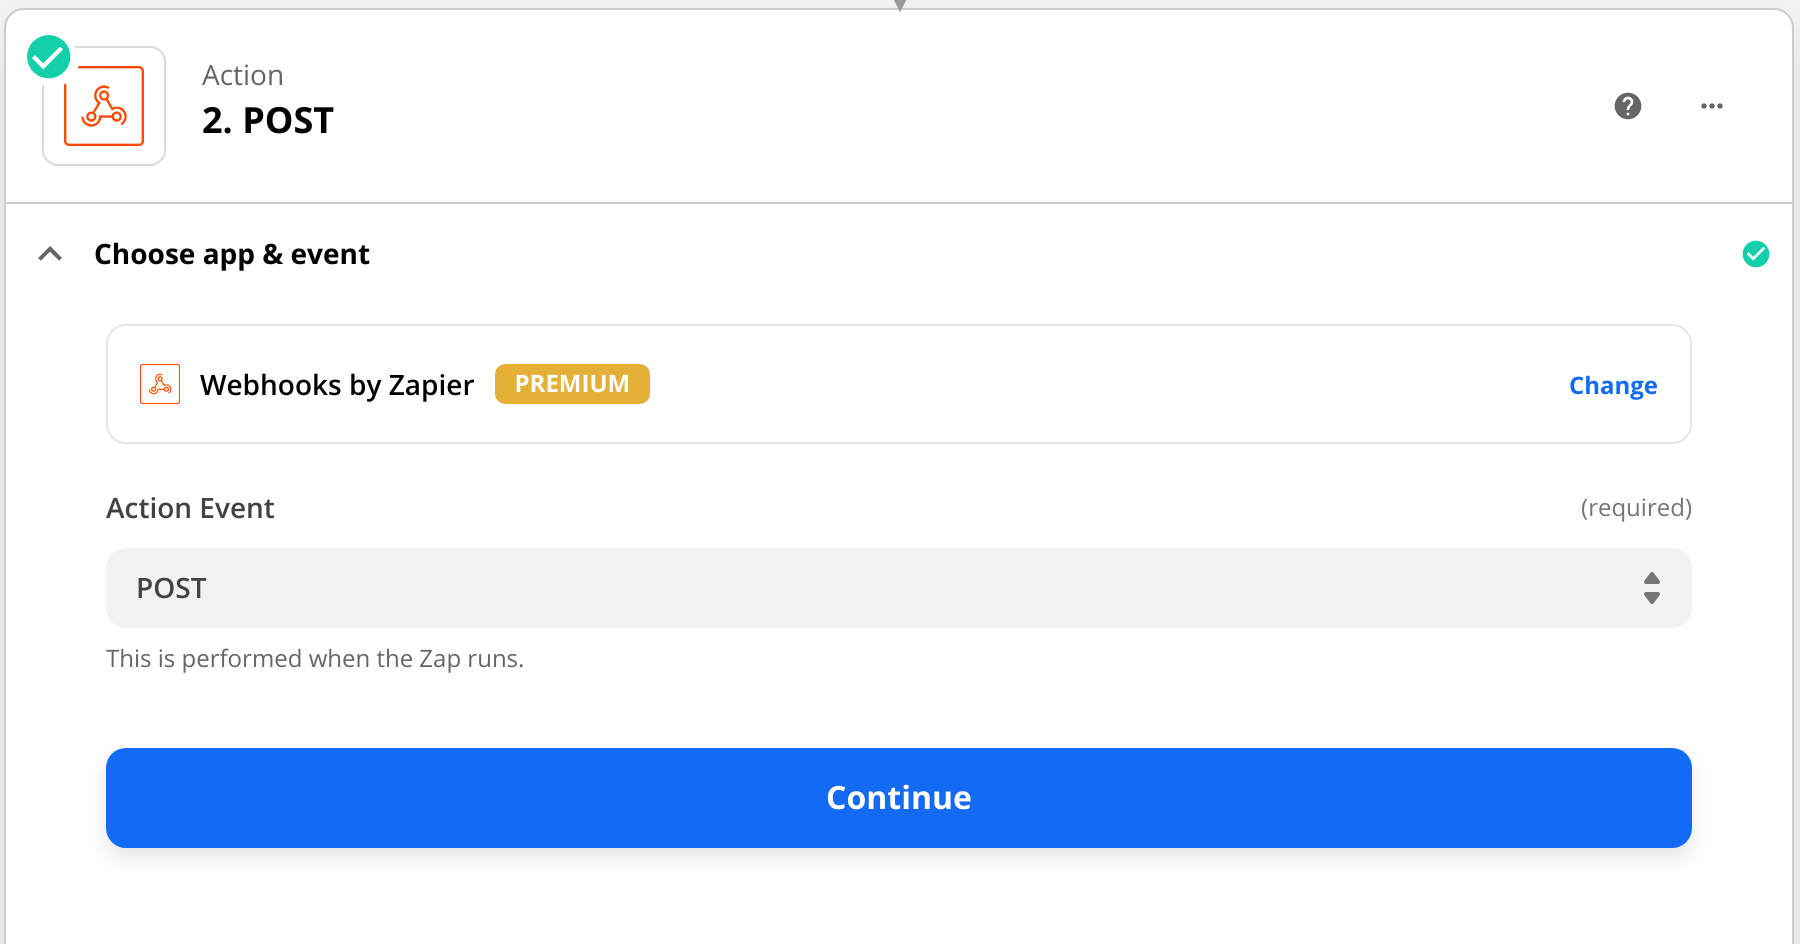
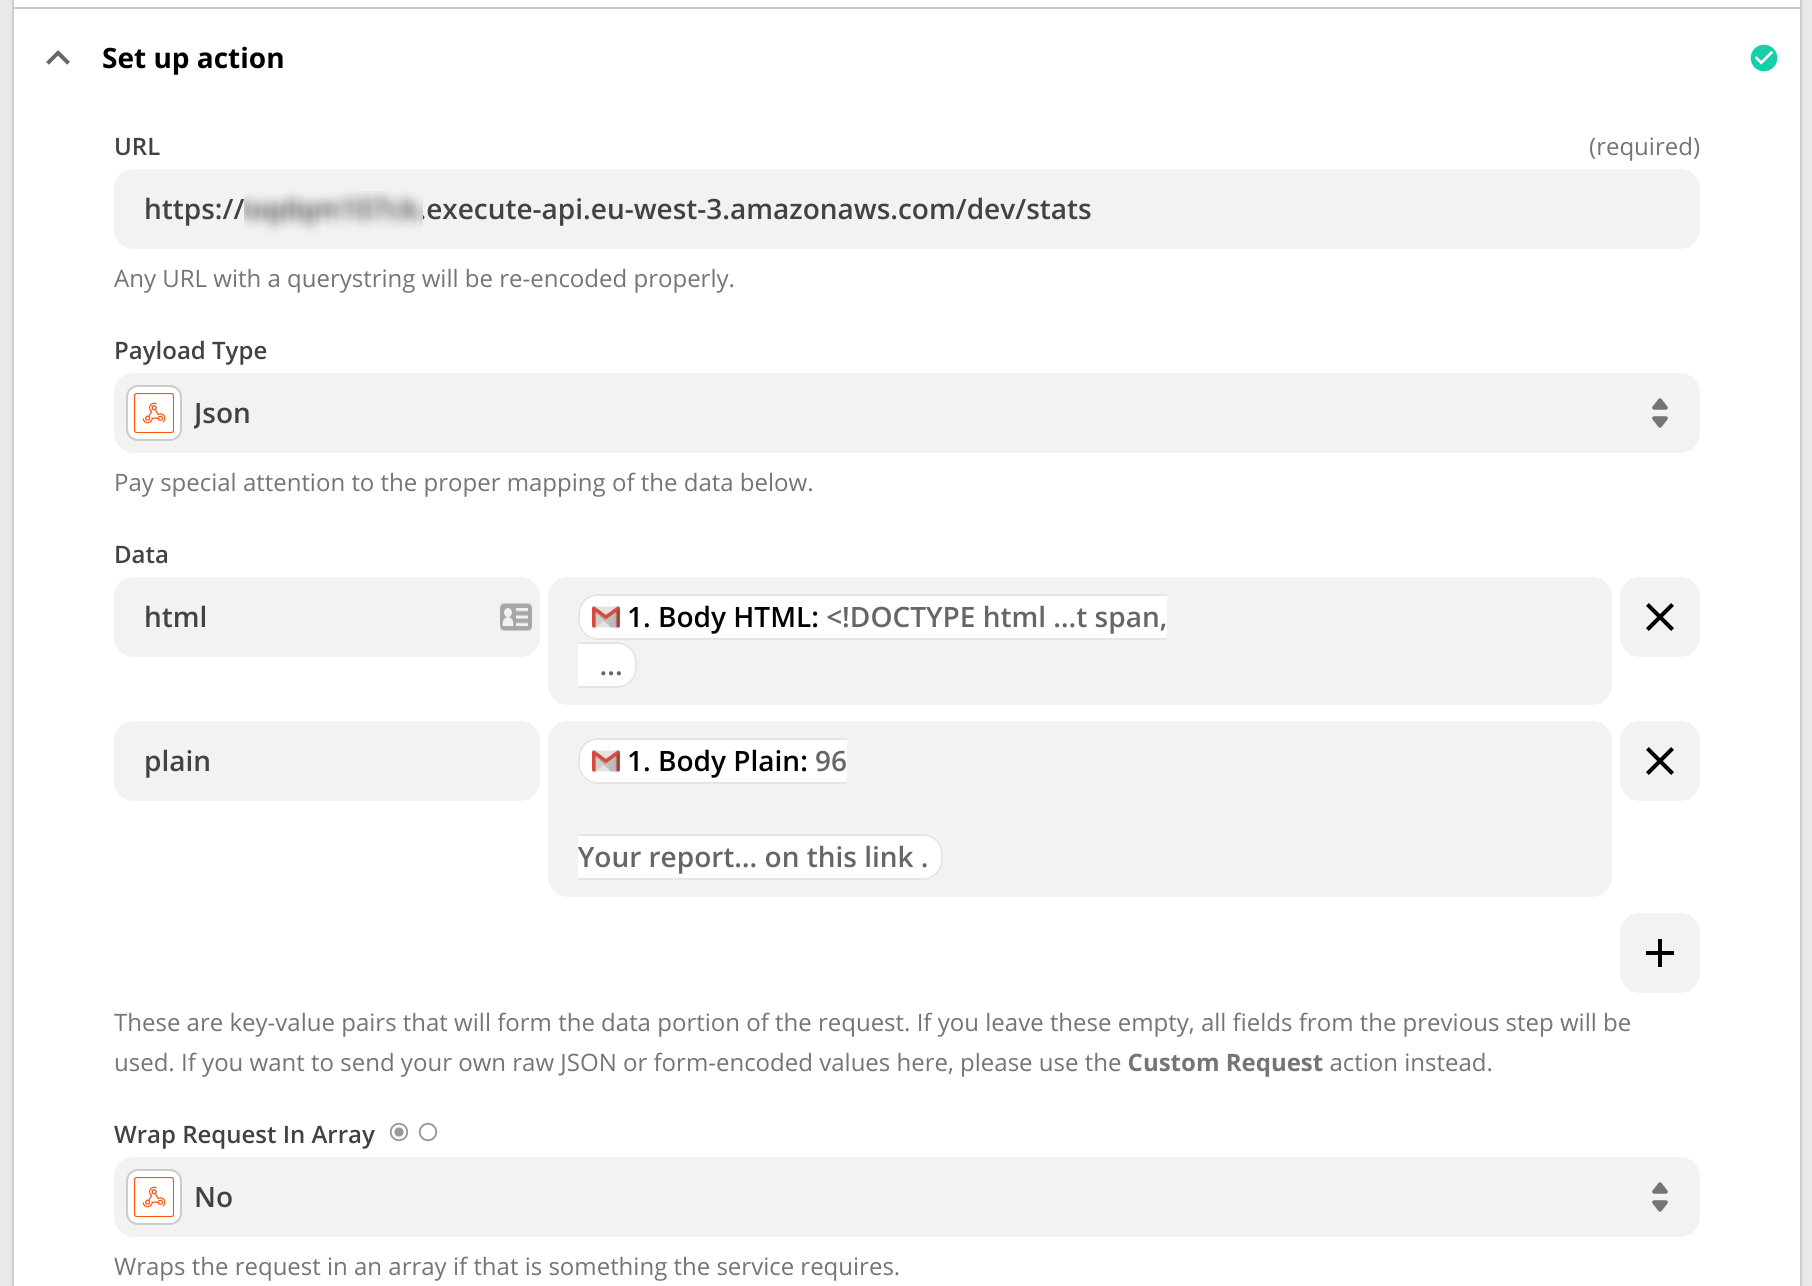
I configured the Zap to trigger on new emails with the ProspectIn label, then POST a JSON object containing the HTML email body to a custom webhook endpoint. The webhook URL is generated using AWS Lambda serverless functions, which provides a cost-effective solution for this type of automation.
The Zapier workflow is straightforward:
- Trigger: Gmail - New Labeled Email
- Action: Webhooks - POST
- Data: JSON payload with the email HTML body
Step 2: The Webhook Implementation
The webhook receives the HTML email content and processes it to extract the performance metrics for each SDR team member.

Parsing with BeautifulSoup
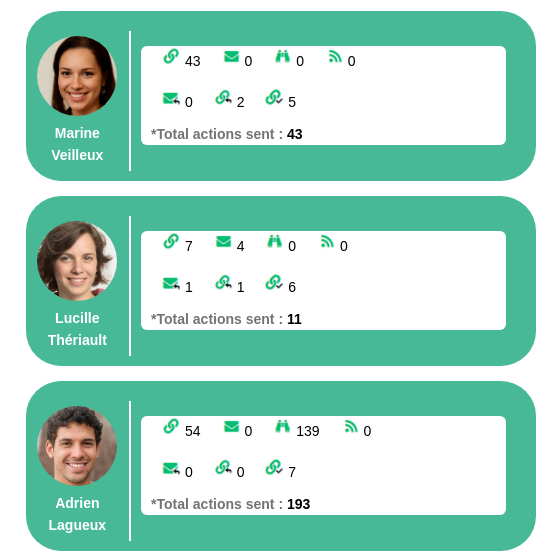
Using BeautifulSoup, the webhook parses the HTML email table to extract SDR performance metrics. The implementation identifies action types by matching persistent icon URLs that appear in the email (e.g., icons for invites sent, profile views, messages sent, etc.).
The webhook:
- Identifies action types by matching icon URLs in the HTML table
- Records metrics for each team member
- Adds a scraping timestamp for temporal analysis and historical queries
- Validates the data structure before storing
Data Storage
PyMongo stores the extracted results in MongoDB Atlas, which offers free clusters suitable for projects like this. MongoDB’s schema-less structure is perfect for this use case since the email format might change over time, and we want flexibility in how we store the data.
Each record in MongoDB includes:
- SDR name
- Action type (invite sent, profile viewed, message sent, etc.)
- Count/value
- Timestamp of data scraping
- Date of the report
Step 3: The Query API
The API layer sits between the MongoDB database and the Retool dashboard, providing a clean interface for data retrieval with flexible filtering options.
API Functionality
The API uses Pandas to format and serve queried data efficiently:
- Accepts a
last_daysparameter for historical filtering - Connects to MongoDB and retrieves relevant records within the specified timeframe
- Calculates individual SDR statistics and aggregates data across the team
- Returns results as JSON arrays that Retool can easily consume
The API is also built as an AWS Lambda function, keeping infrastructure costs minimal while providing reliable performance.
Example Response
When queried, the API returns structured JSON with aggregated performance metrics for each SDR:

Example requests produce organized output showing:
- Total actions per SDR
- Breakdown by action type
- Trends over the specified time period
- Comparative performance across team members
Step 4: Building the Retool Dashboard
Retool provides an intuitive interface for dashboard creation without requiring extensive frontend coding. This makes it easy to build professional-looking dashboards quickly and allows non-technical team members to interact with the data.
Dashboard Configuration
Key steps for setting up the Retool dashboard:
- Created a new project with header and table components
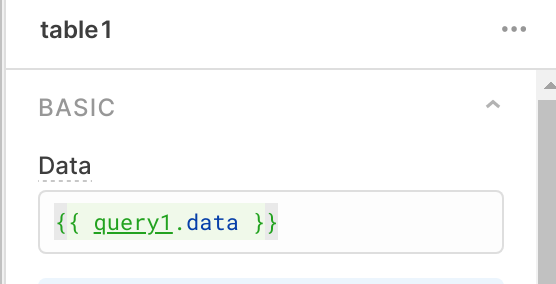
- Configured a REST API resource pointing to the custom Lambda API
- Set up the table to query the API with dynamic parameters

The Retool configuration includes:
- REST API connection to the custom endpoint
- Query parameters for time range filtering
- Automatic data refresh capabilities
- Custom column formatting for better readability
Interactive Features
Tables in Retool offer several powerful features out of the box:
- Dynamic sorting by any column
- Column rearrangement via drag-and-drop
- Pagination for large datasets
- Search and filter capabilities
- Export to CSV or other formats
One click executes “Save & Run” to display live data from the API.

The final dashboard displays aggregated SDR performance metrics in a shareable, interactive format that the entire team can access. Team members can adjust the time range, sort by different metrics, and export data for their own analysis.
Conclusion
This solution demonstrates how combining Zapier, serverless webhooks, database services, and low-code platforms can replicate features typically requiring native integrations. Even when tools don’t provide APIs or export functionality, you can build sophisticated reporting systems using email automation and web scraping.
The key benefits of this approach:
- Cost-effective: Uses free tiers of multiple services (MongoDB Atlas, Zapier free plan, AWS Lambda free tier)
- Maintainable: Each component has a single responsibility, making debugging easier
- Scalable: Can easily extend to additional data sources or metrics
- User-friendly: Retool provides a professional interface that non-technical team members can use
This architecture can be adapted to many similar use cases where you need to aggregate data from tools that lack proper APIs or integrations. The same pattern works for any service that sends regular email reports with structured data.
If you’re facing similar challenges with data aggregation from multiple tools, feel free to reach out. I’m happy to discuss the technical implementation details or help you adapt this approach to your specific use case.